By clicking below you will be redirected to the JLens ETF website
The Impact of Israel Divestment on Equity Portfolios
Summary
This JLens report (“The Impact of Israel Divestment on Equity Portfolios: Forecasting BDS’s Financial Toll on University Endowments”) examines the potential financial impact of Boycott, Divestment and Sanctions (BDS) aligned investment strategies on the 100 largest university endowments. Using historical performance data from 2014-2024, JLens compared a broadly diversified equity index (VettaFi 500) to an index excluding 38 companies specifically targeted by BDS campaigns (VettaFi Excl. BDS Top Targets). The analysis revealed that the BDS-aligned index consistently underperformed, with an annualized return 1.8% lower over 10 years (11.1% vs 12.9%).
Projecting these findings to the 100 largest university endowments from 2023 to 2033, JLens forecasts an aggregate loss of $33.2 billion if these institutions were to adopt BDS-aligned investment strategies for their public equity asset allocations. These projections, based on historical performance data and current endowment allocations, underscore the potentially significant financial consequences of BDS-aligned investment decisions for higher education institutions. The report acknowledges limitations in its methodology and assumptions, but aims to provide a data-driven starting point for discussions on the economic implications of divestment strategies.

Methodology
Step 1: Creation of “BDS Top Targets List”
- JLens reviewed lists of companies targeted by six BDS-aligned organizations (“BDS Proponents”).
- JLens compiled a list[xii] of 38 BDS-targeted companies among the 500 largest U.S. public companies.
Step 2: Selection of benchmark index
- JLens selected the VettaFi US Equity Large-Cap 500 Index[xiii] as the benchmark.
Step 3: Application of the negative screen
- JLens applied the “BDS Top Targets List” as a negative screen to create the VettaFi Excl. BDS Top Targets index.
Step 4: Backtest analysis and performance comparison
- JLens conducted a performance summary backtest of both indices over a ten-year period (2014-2024), as well as for five-year, three-year and one-year intervals.
- JLens analyzed and compared the performance of both indices.
Step 5: Data collection for university endowments
- JLens gathered data on the 100 largest university endowments as of 2023 ($665 billion total AUM).
Step 6: Determination of forecast period
- JLens set a 10-year forecast period from 2023 to 2033.
Step 7: Estimation of public equity allocation
- JLens estimated the portion of university endowments allocated to U.S. large-cap public equities.
Step 8: Application of performance differences
- JLens applied the performance difference between the two indices to the estimated public equity allocations.
Step 9: Calculation of potential underperformance
- JLens calculated the potential underperformance for each university endowment over the 10-year period.
Step 10: Aggregation and analysis of results
- JLens summed up the potential losses across all 100 university endowments and analyzed the overall impact.
The core result suggests that BDS-aligned divestment will likely hurt long-term performance. The VettaFi Excl. BDS Top Targets index consistently underperformed compared to the VettaFi 500 index, lagging on an annualized basis by 1.8% over a ten-year period (11.1% vs 12.9%), 2.4% over a 5-year period (12.7% vs. 15.1%), 2.9% over a 3-year period (6.2% vs 9.1%) and 9.5% over a one-year period (15.4% vs 24.9%).
Annualized Performance of the VettaFi Excl. BDS Top Targets index
Compared to the VettaFi 500 index at benchmark years
VettaFi 500 index
VettaFi Excl. BDS Top Targets index
Findings
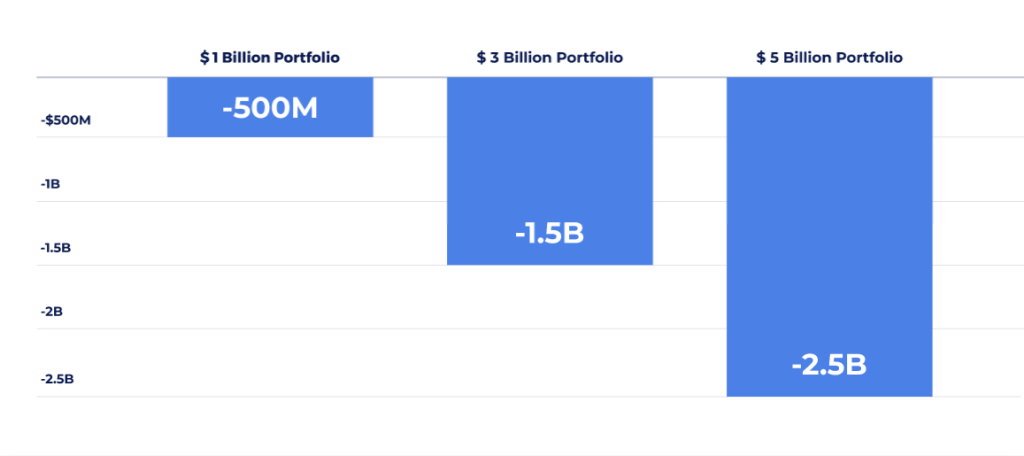
The analysis revealed significant financial implications for university endowments adopting BDS-aligned investment strategies. The performance gap between the indices translates to substantial deviations in portfolio performance over a long period of time. In other words, there are foregone gains when compounded over time. For instance, a $1 billion hypothetical equity allocation invested in the VettaFi 500 index would grow to $3.365 billion over ten years, while the same endowment following the BDS-aligned strategy would only reach $2.865 billion, missing out on nearly $500 million in returns. Similarly, a $3 billion allocation would miss out on nearly $1.5 billion in returns while a $5 billion allocation would miss out on nearly $2.5 billion of returns.
Financial Impact of Divestment
July 2014 – June 2024
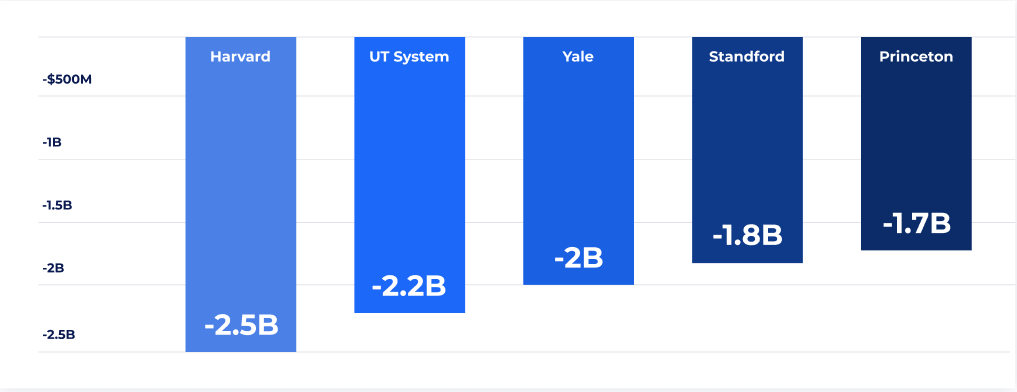
Projecting these findings to the 100 largest university endowments from 2023 to 2033, JLens forecasts an aggregate loss of $33.2 billion if these institutions were to adopt BDS-aligned investment strategies for their public equity asset allocations. The five largest endowments could each face average losses ranging from $1.7 billion to nearly $2.5 billion in future market value. These projections, based on historical performance data and current endowment allocations, underscore the potentially significant financial consequences of BDS-aligned investment decisions for higher education institutions.
Projected 10 Year Loss of Value for Top 5 University Endowments
Based on the difference between VettaFi 500 index and VettaFi Excl. BDS Top Targets index returns

